How it all started
I only wanted to learn visual basic so that I could automate those tedious, repetitive tasks.
As I was watching a video tutorial by Wise Owl, the YouTube recommender algorithm did its magic and
displayed someone comparing Google and IBM's data analytics programs.
Then one thing lead to another, or I should say one specialization followed by another.
Learning in a new field takes a lot of passion, devotion, and discipline to keep moving and stay motivated. Understanding the fundamentals of statistics, probability, programming, and business analytics is not easy. Writing code to produce meaningful graphs is one thing; having a statistical background to analyze these graphs is another. I spend hours trying to understand what, why, and how things function. Most of the time, I'm happy with the results, but sometimes I find that the more I delve into it, the more complicated it becomes. Moving into the path of data science is daunting but is fulfilling.
It's a never-ending adventure of
building and debugging.
--- Things I do ---
Data Analysis
 The goal of analysis, whether it be descriptive, diagnostic, prescriptive, or predictive, is to provide us with solutions.
This section focuses on handling file formats, investigating various methodologies (such as RFM, Cohort, and Monte Carlo), and displaying results.
The goal of analysis, whether it be descriptive, diagnostic, prescriptive, or predictive, is to provide us with solutions.
This section focuses on handling file formats, investigating various methodologies (such as RFM, Cohort, and Monte Carlo), and displaying results.
Text Analytics
This section is all about text analytics, especially Sentiment Analysis, Text Categorization, and Text Mining.
Text analytics can be used to uncover current trends as well as discover what our customers thought of our
products and services. NLP through the internet could be used to determine the people's current conundrums.
Do you recall the "piggy bank" with the goal label? By simply modifying the product's appearance,
it generated significant sales from regular goods, It answer to people problem of saving money.
Machine Learning
 Machine learning is a branch of artificial intelligence (AI) and computer science which
focuses on the use of data and algorithms to imitate the way that humans learn, gradually
improving its accuracy.
Machine learning is a branch of artificial intelligence (AI) and computer science which
focuses on the use of data and algorithms to imitate the way that humans learn, gradually
improving its accuracy.
Various machine learning algorithms will be used in this section depending on the project.
To determine the optimum model for the problem, multiple feature engineering and feature selection methodologies will be used.
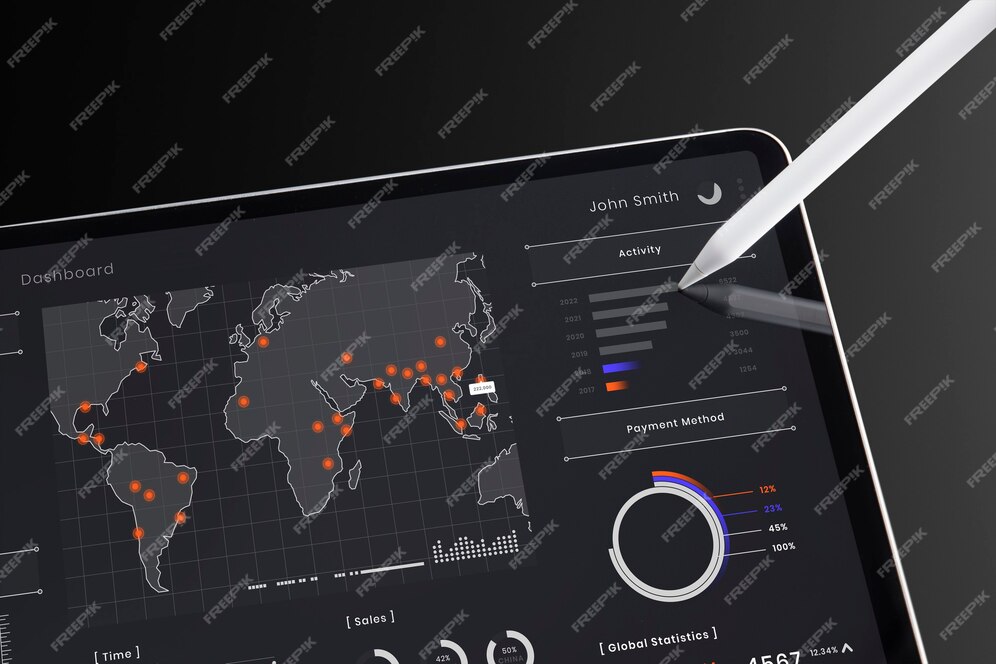
Data Visualization
Data visualization is the graphical representation of information and data. It is utilized in several stages of the data analysis pipeline. Insights into trends, outliers, and patterns can be gained by using graphs and charts. It's also a fantastic opportunity to share what we learned about the data.